

Proxy health monitoring means continuously tracking latency percentiles, error rates, connection-pool utilization, and throughput to confirm a proxy layer is routing traffic correctly and fast. The single most important action is turning these on today: enable proxy-side metrics, wire them into a dashboard, and set two or three alerts before you do anything else. Everything past that, tuning thresholds, isolating root cause, building SLOs, is refinement.
TL;DR:
- Tracking latency percentiles, especially p99.9, is crucial for identifying tail latency issues that can affect critical user transactions.
- Separating proxy processing time from upstream latency helps pinpoint whether slowdowns originate in the proxy layer or backend services.
- Combining active and passive health checks provides faster failure detection while minimizing load on backend systems.
- Setting alert thresholds based on sustained latency and utilization conditions prevents alert fatigue and ensures meaningful incident response.
- Using stable, predictable proxies like static ISP options simplifies baseline monitoring and reduces false positives caused by bandwidth or IP churn.
Table of Contents
- What Metrics Should You Track for Proxy Health Monitoring?
- Active vs. Passive Health Checks: Which Do You Need?
- How Do You Configure Proxy Health Checks Correctly?
- Alerting and SLOs: How Do You Avoid Alert Fatigue?
- Proxy Error or Upstream Error: How Do You Tell?
- Which Tools Actually Show You Proxy Health?
- How Proxy Choice Changes What You Monitor
- What I'd Prioritize First
- Why Your Proxy Choice Shapes Your Monitoring Baseline
- Sources
- FAQ
What Metrics Should You Track for Proxy Health Monitoring?
Averages hide problems. A proxy averaging 40ms can still be torturing 1% of your traffic with 2-second stalls, and that 1% is usually your biggest customer's checkout flow. That's why latency percentiles matter more than means: p50 tells you the typical experience, p95 shows where things start to strain, and p99.9 captures the tail latency where proxies may experience failures; it captures the retries, DNS hiccups, and connection-pool exhaustion that averages smooth over.

Separating proxy processing time from upstream processing time is the other half of the equation. Consul's proxy metrics tutorial treats this split as standard practice, because it tells you immediately whether a slowdown originates in your proxy layer or in the backend it's forwarding to.
A useful dashboard groups these into four widgets:
- Latency percentiles (p50/p95/p99.9) split by proxy vs. upstream time
- Error rate by status code, segmented by origin
- Requests per second and active connection count
- Connection-pool utilization, ideally with a saturation threshold line
Pro Tip: If your dashboard only shows an average latency line, consider adding p99.9 percentile metrics to capture tail latency.
Active vs. Passive Health Checks: Which Do You Need?
Active checks probe endpoints on a schedule. Passive checks watch live traffic and eject unhealthy backends based on real failures. Most production setups need both.
- Active checks poll a target at a fixed interval (commonly 5 to 15 seconds), using HTTP GET/HEAD, TCP connect, gRPC health protocol, or raw L3/L4 checks, and mark a backend down after a set number of consecutive failures.
- Passive/outlier detection skips the extra probe traffic entirely and instead flags a backend as unhealthy when real requests start failing or timing out, which Envoy's health-checking model supports natively alongside its active checks.
- Protocol-specific checks matter for non-HTTP backends. Redis, Thrift, and gRPC each need their own check type rather than a generic TCP ping, since a TCP handshake succeeding doesn't mean the application layer is healthy.
The trade-off is simple: active checks catch failures faster but add load; passive detection is free but reacts only after real requests already failed.
How Do You Configure Proxy Health Checks Correctly?
Four parameters control almost every health-check behavior: the check interval, the timeout, the pass/fail thresholds, and the expected response. Apache's mod_proxy_hcheck names these directly as hcinterval, hcpasses, hcfails, and hcmethod, and the same concepts apply almost everywhere else under different labels, as Apache's documentation shows.
Sensible starting points for most HTTP backends:
- Interval: around 10 to 15 seconds
- Timeout: 2 to 3 seconds (well below the interval)
- Failure threshold: a small number of consecutive failures before marking down
- Recovery threshold: 2 consecutive successes before marking healthy again
- Expected codes: 200 to 399, tightened per endpoint if needed
Apache's ProxyHCExpr pattern lets you validate more than a status code by checking response body content or specific headers, which catches a backend that returns 200 but with an empty or garbled payload.
Pro Tip: Checking too aggressively backfires. An interval under 5 seconds on a large backend fleet can generate enough probe traffic to become its own load problem.
Alerting and SLOs: How Do You Avoid Alert Fatigue?
An alert that fires every time p99.9 twitches will get muted within a week. Build alerts around sustained conditions, not single data points.
- Alert on p99.9 latency exceeding a set threshold for at least three consecutive intervals, not one spike.
- Alert on connection-pool utilization sustained above roughly 85% for five minutes, since that's the leading indicator of imminent saturation.
- Alert on error rate crossing a defined percentage over a rolling window, split by proxy-origin vs. upstream-origin errors so on-call knows where to look first.
- Build your SLO on the same two or three signals: availability (successful responses / total), and a latency SLI at p99.9, not p50.
- Reduce noise with multi-metric conditions, require latency AND error rate to move together, and group related alerts so one incident doesn't page five people separately.
A short on-call checklist (status codes, pool utilization, recent deploys) closes most incidents before they escalate.
Proxy Error or Upstream Error: How Do You Tell?
The fastest way to separate the two is a status-code header appended at the proxy layer. VGS appends a vgs-upstream-status-code header specifically so engineers can compare what the proxy returned against what the upstream actually sent, according to VGS's performance monitoring documentation. If the header shows a healthy upstream code but the client received a 502, the failure is in the proxy layer, not the backend.
From there, work through this sequence:
- Compare proxy processing time against upstream processing time on the same request
- Check connection-pool metrics and socket states for exhaustion or lingering half-open connections
- Look at DNS resolution timing separately. Slow DNS often masquerades as generic latency
- Pull correlated logs, traces, and health-check state changes into one timeline
A single appended header can cut root-cause time from an hour of guessing to a five-minute diff between two status codes.
Which Tools Actually Show You Proxy Health?
Most engineers end up combining a generic metrics stack with whatever the proxy itself exposes.
- Prometheus and Grafana are the default for scraping proxy sidecar metrics, particularly in Consul or Envoy deployments, where the sidecar exposes latency, connection, and error metrics that Prometheus pulls on a schedule and Grafana turns into panels.
- AWS CloudWatch does this automatically for managed services. RDS Proxy's monitoring dashboard ships pre-built widgets for latency, connection pools, and client connections without any manual wiring.
- Trickster exposes a dedicated
/trickster/healthendpoint per backend, with configurable timeout, interval, and expected response format, useful as a pattern to copy in custom setups. - Envoy and Apache mod_proxy_hcheck expose raw check state and pass/fail counts directly; you generally still have to derive percentiles and pool-saturation trends yourself from the raw counters.
The pattern across all of them: availability and basic latency are usually exposed for free. Percentile breakdowns and cross-layer time splits usually require you to build the dashboard yourself.
How Proxy Choice Changes What You Monitor
Static ISP proxies behave like a fixed backend: consistent latency baselines, so tighter thresholds work well and any drift is a real signal worth chasing. Rotating residential proxies behave differently. Session stickiness and IP churn mean your baseline latency band needs to be wider, and throughput monitoring matters more than raw latency alone.
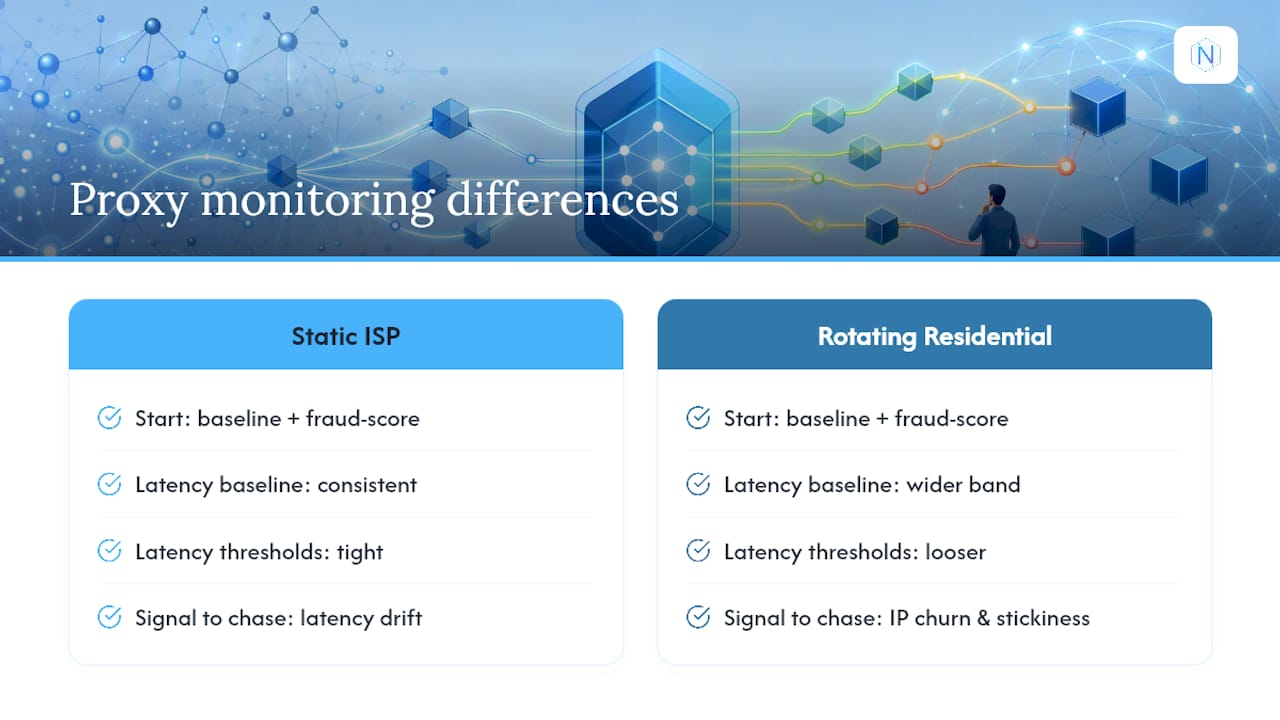
Before scaling any workload, run a baseline test and a fraud-score check so your dashboard starts from real numbers, not guesses. If you're building for scraping specifically, proxy type selection itself shapes your monitoring thresholds before you write a single alert rule.
What I'd Prioritize First
If you only fix one thing this week, fix alerting order: availability first, p99.9 latency second, pool saturation third. Most teams tune check frequency too aggressively before they've even confirmed their thresholds match real backend capacity. Watch for that mistake before anything fancier.
— proxy
Why Your Proxy Choice Shapes Your Monitoring Baseline
Monitoring only tells you the truth if the proxy underneath it behaves predictably. Natproxies gives you that starting point: static ISP proxies with unlimited bandwidth mean your latency baselines stay clean instead of shifting every time a bandwidth cap throttles traffic, which is exactly the kind of noise that breaks alert thresholds before you even get to real incidents.

If you're setting up proxy health monitoring for the first time, start small: spin up a handful of IPs from the AT&T Fresh ISP plan, priced at $2.75 per IP per month, run a 24 hour baseline test, and hook the results into Prometheus and Grafana before scaling the pool. For workloads that need geographic spread instead of fixed IPs, the rotating residential option gives you country, state, and city targeting without the session churn wrecking your latency graphs. Check current pricing and plans to size the right pool for your baseline test.
Sources
- Monitor application health and performance with Consul proxy metrics | Consul | HashiCorp Developer
- Health checking — Envoy
FAQ
What Is Proxy Health Monitoring?
Proxy health monitoring is the practice of tracking latency, error rates, throughput, and connection-pool utilization to confirm a proxy layer is routing traffic correctly. It relies on active checks, passive detection, and dashboards to catch failures before they reach end users.
What's the Difference Between Active and Passive Health Checks?
Active checks poll a backend on a fixed schedule using HTTP, TCP, or gRPC methods and mark it unhealthy after consecutive failures. Passive checks, also called outlier detection, watch real traffic and eject a backend the moment live requests start failing, as described in Envoy's health-checking documentation.
How Do I Tell a Proxy Error From an Upstream Error?
Compare the status code the proxy returned against the actual upstream response code, typically exposed through an appended header. VGS's monitoring documentation shows this pattern using a dedicated upstream-status header that separates the two instantly.
Why Does p99.9 Latency Matter More Than Average Latency?
Averages hide the worst-affected requests, while p99.9 captures the retries, timeouts, and pool exhaustion that hurt real users. A proxy with a low average can still have a painful p99.9 tail that signals an underlying capacity problem.
Does Natproxies Support Proxy Health Monitoring?
Natproxies doesn't run your monitoring stack, but its static ISP proxies keep latency baselines stable, and unlimited bandwidth removes throttling as a source of false alerts. Pricing for the AT&T Fresh ISP plan starts at $2.75 per IP per month, making it practical to run a small baseline pool before scaling.